- Analytics
- Technical Analysis
XAUUSD Technical Analysis - XAUUSD Trading: 2022-04-18
Gold Technical Analysis Summary
Above 1980
Buy Stop
Below 1860
Stop Loss
| Indicator | Signal |
| RSI | Neutral |
| MACD | Buy |
| MA(200) | Neutral |
| Fractals | Buy |
| Parabolic SAR | Buy |
| Bollinger Bands | Buy |
Gold Chart Analysis
Gold Technical Analysis
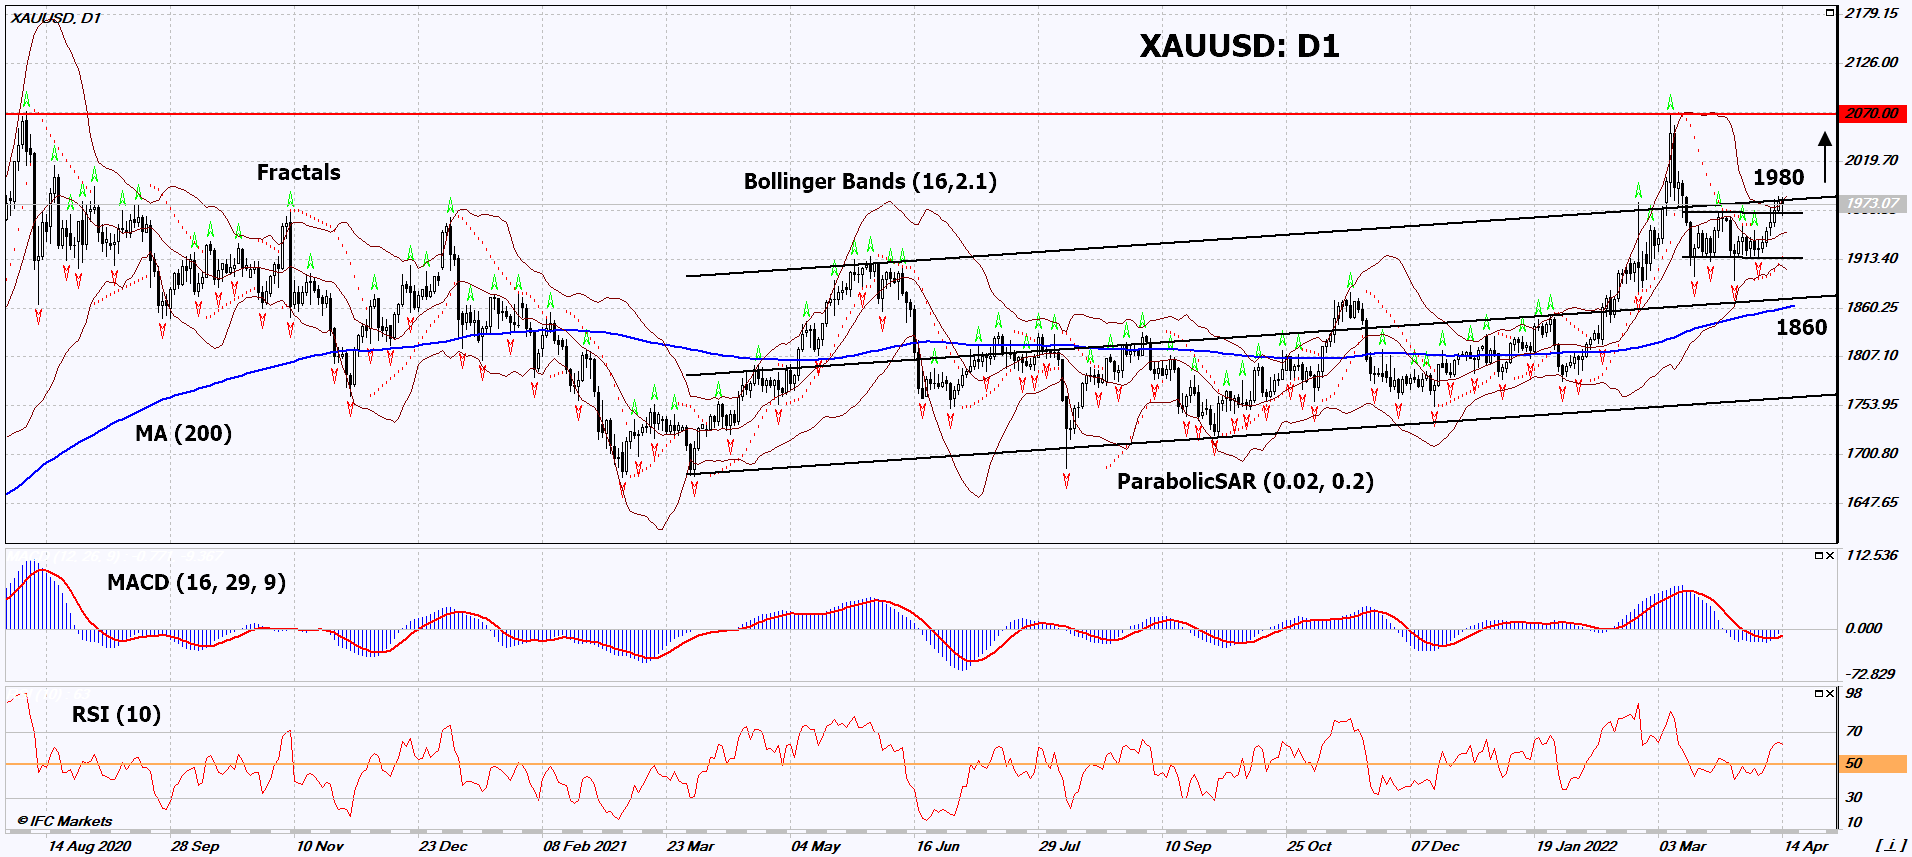
On the daily timeframe, XAUUSD: D1 is trying to get out of the long-term ascending channel. A number of technical analysis indicators formed signals for further growth. We do not rule out a bullish movement if XAUUSD: D1 rises above the last high and upper Bollinger band: 1980. This level can be used as an entry point. The initial risk limit is possible below the Parabolic signal, the last 2 lower fractals, the lower Bollinger band and the 200-day moving average line: 1860. After opening a pending order, we move the stop following the Bollinger and Parabolic signals to the next fractal low. Thus, we are changing the potential profit/loss ratio in our favor. The most cautious traders after making a trade can go to the four-hour chart and set a stop-loss, moving it in the direction of movement. If the price overcomes the stop level (1860) without activating the order (1980), it is recommended to delete the order: there are internal changes in the market that were not taken into account.
Fundamental Analysis of Precious Metals - Gold
High inflation in the US could boost demand for precious metals. Will the XAUUSD quotes continue to increase?
In March, inflation in the US reached a 40-year high (since 1981) and amounted to 8.5% y/y. The growth of the United States Producer Price Index (inflation in industry) amounted to 11.2%. This is much more than the Fed's rate, which is currently 0.5%. According to forecasts, the rate will be increased by another 0.5% at the next Fed meeting on May 4. Further tightening of monetary policy is also expected. However, investors fear that inflation may exceed the return on dollar assets for a long time. For example, the United States 10-Year Bond yield is now at its highest since December 2018 and is now 2.83% per annum, while the 30-Year Bond is 2.93% per annum. An additional positive factor for precious metals could be the political crisis in Eastern Europe.
Note:
This overview has an informative and tutorial character and is published for free. All the data, included in the overview, are received from public sources, recognized as more or less reliable. Moreover, there is no guarantee that the indicated information is full and precise. Overviews are not updated. The whole information in each overview, including opinion, indicators, charts and anything else, is provided only for familiarization purposes and is not financial advice or а recommendation. The whole text and its any part, as well as the charts cannot be considered as an offer to make a deal with any asset. IFC Markets and its employees under any circumstances are not liable for any action taken by someone else during or after reading the overview.


