- Education
- Introduction to Trading
- How to Read Stock Charts
How to Read Stock Charts
Picture this: You're trying to decide which stocks to invest in, but you feel like you're drowning in a sea of numbers and information. How can you make sense of it all? Enter stock charts! These first-rate graphs give you a visual representation of a stock or index's price and volume over a specific period of time.
And they're not just pretty pictures - savvy investors and analysts use them to spot trends and make smart investment choices. So buckle up, because we're going to teach you the basics of how to read stock charts like a pro.

KEY TAKEAWAYS
- Ability to read a chart is like the ability to read a bank statement.
- A price chart is a special language that requires special understanding
- Stock charts are visual representations of the price and volume of a particular stock or index over a certain period of time.
- By analyzing the price movement and trends of a stock or index using stock charts and technical indicators, investors can make informed decisions about buying, selling, or holding their investments.
How to Read Stock Charts
So, the ability to read a chart is like the ability to read a bank statement. The reason why a bank statement is understandable is that it is written in a language that we understand. A price chart is a special language that requires special understanding. Price chart is a unique language, and reading it can reveal quite accurate forecasts of the future for trading stocks profitably.
But what does it mean to be able to read a chart?
Being able to read a chart means being able to see trends or tendencies on the time frame. Prices on the market do not change chaotically. Their changes are subject to trends. However, at the initial stage of studying, it is very difficult to see trends in principle.
And even more so, those that correspond to the open time frame. And in fact, for 5M - there are certain trends, and for D - others. It is important to correctly correlate and work with the trends of the time frame that is working for you.
- Being able to read a chart means seeing key levels; Key levels are those points on the chart where the price changed its movement to the opposite. For me, these are critical values.
- Being able to read a chart means seeing position accumulation zones.
- Being able to read a chart means seeing price changes that behave in a special way before a rise or fall; I mean the ability to see technical analysis patterns such as tweezers, head and shoulders, flag, etc.
- Being able to read a chart means understanding in which phase of its development the trend is in (development or correction);
Being able to read a chart means correlating price behavior with volume indication. Volumes are a very important indicator that, when used correctly, allows us to understand the market's logic.
In the simplest terms, trends should be supported by increased volumes, while volumes decrease during a correction. With the help of volumes, we see the accumulation of positions by a large investor, as well as when the major player is selling off.
In conclusion, I can definitely say that the ability to read and understand a chart is the main skill for profitable trading for a trader.
Download MetaTrader 4 and start practicing on reading stock charts.
What are Stock Charts
Stock charts are visual representations of the price and volume of a particular stock or index over a certain period of time. They are used to display the historical performance of a stock or index and to identify trends, patterns, and potential opportunities in the stock market.
Generally, the price is plotted on the y-axis (vertical axis) while time is plotted on the x-axis (horizontal axis) in a stock chart.
There are different types of stock charts available, including line charts, bar charts, and candlestick charts, each providing different information about the price movement of the stock or index. Investors, traders, and analysts use stock charts to analyze the past performance of a stock and make informed investment decisions.
Types of Stock Charts
There are four types of stock charts that are basically used in technical analysis:
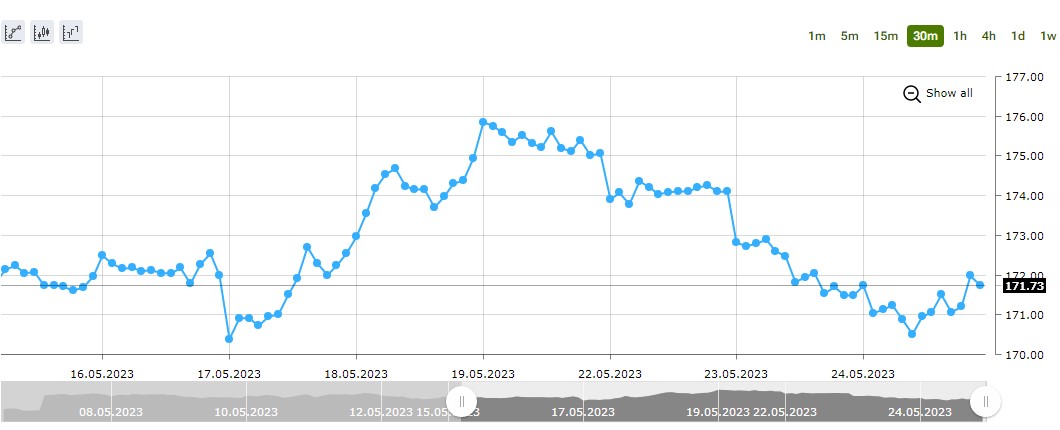
Line Charts
Line charts are the simplest type of stock charts. They show the closing prices of a stock or index over a certain period of time. Each data point on the chart represents the closing price for that day or period.
Line charts are useful for identifying long-term trends in the price movement of a stock or index. However, they do not provide information about the high or low prices during the period.

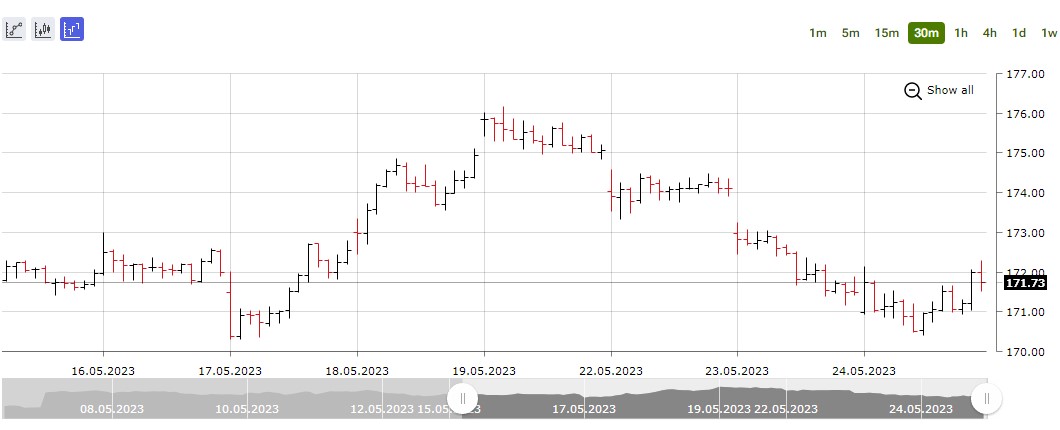
Bar Charts
Bar charts are more detailed than line charts as they provide information about the high, low, opening, and closing prices of a stock or index for a particular period. Each bar on the chart represents the price range for that period, with the top of the bar indicating the high price, the bottom indicating the low price, and the horizontal lines indicating the opening and closing prices.
Bar charts are useful for identifying short-term price movements and trends, and for determining the strength of the price movement.

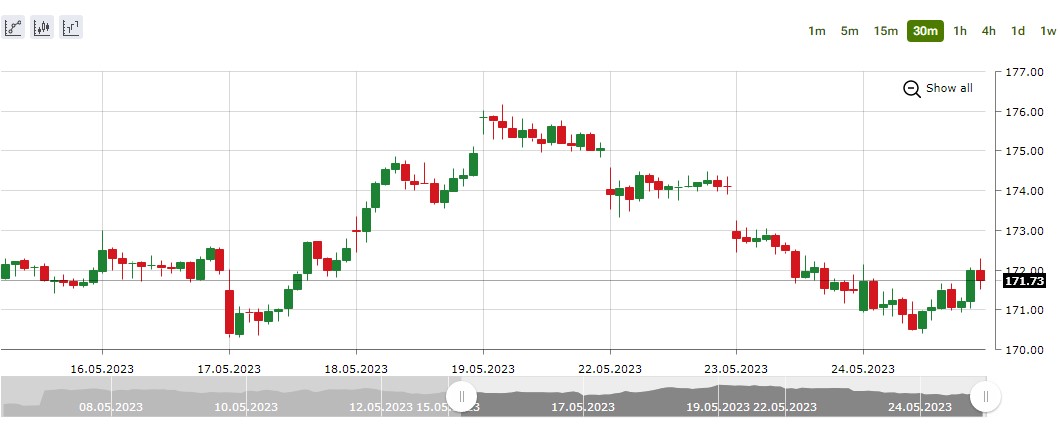
Candlestick Charts
Candlestick charts are similar to bar charts in that they provide information about the high, low, opening, and closing prices of a stock or index for a particular period. However, candlestick charts are more visually appealing and provide more detailed information about the price movement.
Each candlestick on the chart represents the price range for that period, with the top of the candlestick indicating the high price, the bottom indicating the low price, and the body of the candlestick indicating the opening and closing prices. The color of the candlestick can also provide additional information, with green or white candles indicating an uptrend and red or black candles indicating a downtrend.
Candlestick charts are useful for identifying short-term price movements and trends, and for determining the strength of the price movement.

Technical Indicators in Stock Charts
In addition to the basic price and volume information provided by stock charts, technical analysts also use various technical indicators to analyze the price movement and trends of a stock or index.
Moving Averages
Moving averages are one of the most commonly used technical indicators. They provide information about the average price of a stock or index over a certain period of time. Moving averages can be calculated for different time periods, such as 50-day, 100-day, or 200-day moving averages.

Moving averages are useful for identifying trends in the price movement of a stock or index, and for determining support and resistance levels.
Relative Strength Index (RSI)
The Relative Strength Index (RSI) is a momentum indicator that measures the strength of a stock or index's price movement. It compares the average gains and losses over a certain period of time to determine whether a stock or index is overbought or oversold.

The RSI is useful for identifying potential trend reversals and for determining entry and exit points for trades.
Bollinger Bands
Bollinger Bands are another popular technical indicator that measures the volatility of a stock or index. Bollinger Bands consist of three lines: a simple moving average (usually 20 periods), an upper band (typically two standard deviations above the moving average), and a lower band (typically two standard deviations below the moving average).

Bollinger Bands are useful for identifying potential trend reversals and for determining support and resistance levels.
Moving Average Convergence Divergence (MACD)
The Moving Average Convergence Divergence (MACD) is a trend-following momentum indicator that compares two moving averages of a stock or index's price. The MACD line is the difference between the two moving averages, while the signal line is a moving average of the MACD line.

The MACD is useful for identifying changes in the momentum of a stock or index's price movement.
Bottom Line on How to Read Stock Charts
To effectively read stock charts, it is important to understand the basic types of charts available and the information they provide. Line charts are useful for identifying long-term trends, while bar and candlestick charts provide more detailed information about short-term price movements.
Technical indicators can also provide valuable information about the strength and direction of a stock or index's price movement. Moving averages, RSI, Bollinger Bands, and MACD are some of the most commonly used technical indicators.
It is important to note that stock charts and technical indicators should not be used in isolation. They should be used in conjunction with other information, such as company financials and industry trends, to make informed investment decisions.
And finally, understanding how to read stock charts is an important skill for investors, traders, and analysts. By analyzing the price movement and trends of a stock or index using stock charts and technical indicators, investors can make informed decisions about buying, selling, or holding their investments.

