- Innovations
- PCI Quick Guide
- Working with PCI Charts
Working with PCI Charts
Through trading-analytical platform NetTradeX you can get deep price history of any of your synthetic instrument, which will be updated in real time mode. Price history can be presented in the form of different chart types (bars, candlesticks and lines) at various time frames. To open a chart of price history of the created synthetic instrument PCI you should:
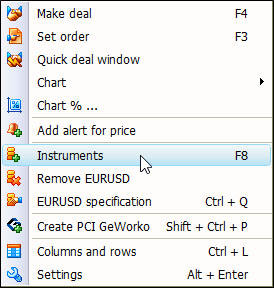
If the PCI you need is in the list of the used instruments ("Market Watch" window), then go directly to the step 3. If this previously created PCI is not in the list of the used instruments, then you need to transfer this PCI to the list from the "Instrument Browser". To do this, you can use the context menu in the "Market Watch" window or select "Trade -> Instruments" option in the main menu.

In the opened "Instrument Browser" window expand the list of the created PCIs - on the right side of the "All Instruments" section, click on the "+" on the left of the "My Instruments" group. In the opened list of the PCI, tick the check-box next to the new instrument. To add the selected PCI to the list of the used instruments, drag the cursor (holding the left-click mouse button) over this PCI in the left section "In Use". Then close the window.
After adding PCI to the list of "Instruments in Use", you will be able to display the chart of its price history on the screen. To do that, find the added PCI in "Market watch" window and right-click on its name. From the drop down menu select "Chart" item and specify your preferable time frame.
After opening the price history chart of the new PCI, you will be able to start technical analysis.
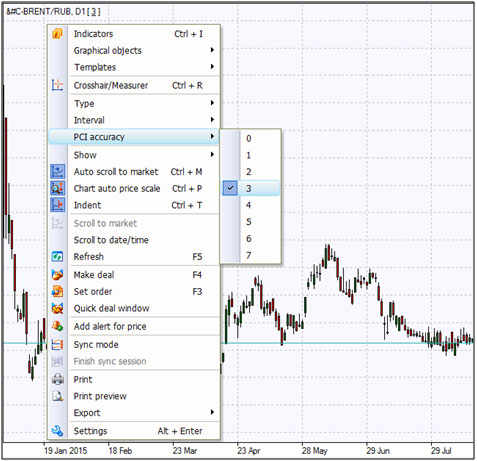
It is noteworthy the following feature of PCI charts - calculation of such PCI is performed by the specialized server with the set accuracy. The accuracy of the calculation and the display of the historical data can be set on the PCI chart by the context menu in the "PCI accuracy" parameter accepting values from 0 to 7 (3 by deafult). The value of this parameter defines the calculation depth in the sequence of timeframes - for example, in case of the value =3 for calculating the H1 chart the server uses the historical data of the separate components from 5 minutes timeframes. The higher the value of the "PCI accuracy," the more time is spent on chart calculation. Current valu of the accuracy is set in the information line on the upper left corner of the chart in square brackets. The chart, formulated in real time while the client terminal is switched on, has a maximum possible accuracy regardless the value of this parameter. The PCI on charts does not influence the accuracy of the deal performance and order activation.

