- Trading
- Program Trading
- Advisors for NetTradeX
- The Basics of Writing User Indicators
The Basics of Writing User Indicators
Introduction
The present article has been written with a view to explain and illustrate the principles of creating user indicators and examine the pitfalls which programmers may encounter when taking their first steps in the development in NTL+ (the NetTradeX Language).
As drawing up the algorithm of a user indicator, you will need to determine how the values that will get written in the indicator's buffer will be calculated and displayed on the screen. The correct formation of these values is the ultimate goal of indicator implementation.
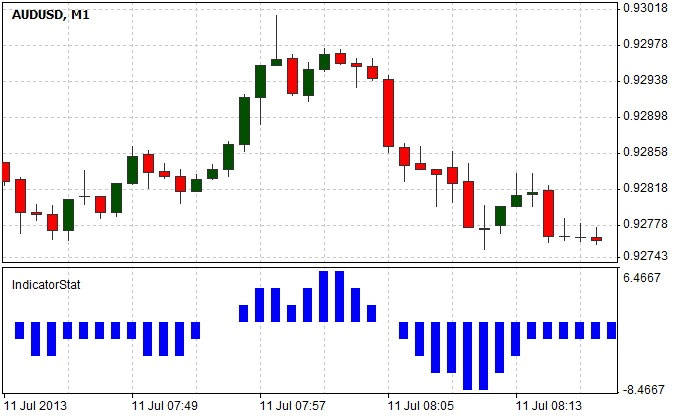
As an example, let us create an indicator that will be showing the difference between the number of bars, with the closing price higher than the opening price, and the number of bars, with the closing price lower than the opening price, for the last n intervals. We will display our indicator as a histogram in a separate window.
Writing the script code
The algorithm we will be using is simple and intuitive enough so as to easily check the indicator’s operation on the chart. We will analyze the previous n bars for each i-bar and form statistics, where we will be adding 1 to the resulting value if the bar rises and deducting 1 in case the bar drops.

Let us examine the indicator code:
First, we should declare all the variables that will be used in our indicator.
#set_indicator_separate
double ExtMapBuffer1[];
int ExtCountedBars=0;
extern int period = 10;
The #set_indicator_separate is a preprocessor directive indicating that the chart will be displayed in a separate window without overlapping with the main price chart. The next line declares the global array ExtMapBuffer1 where the indicator buffer values will be stored. It should be noted that we do not specify the size of the array, as the compiler itself will allocate the necessary memory amount. The ExtMapBuffer1 array actually stores the ordinates of the points included in the chart, with their abscissas being defined by the index of the array elements. Then we initialize the ExtCountedBars variable value to 0; it will store the number of already calculated bars. Thus there will be no need to perform routine calculations for all the bars, which greatly speeds up the calculation of the indicator values as well as the movement of the indicator chart. The next line declares the period global variable that will be storing the number of intervals, on which the indicator calculates its statistics. Please note that the extern modifier usage allows us to change the period parameter by means of the indicator properties without any necessity of recompilation.
Let us consider the Initialize() function, in which we will specify the basic settings for our indicator.
The SetIndexCount method of the Indicator object sets the quantity of buffers for indicator values. We have one buffer with ExtMapBuffer1 values, so we specify 'one' as the only parameter. We will also need to link the buffer number to an array with the buffer values. This link is defined in the line Indicator.SetIndexBuffer(0,ExtMapBuffer1), in which it is specified that the zeroth indicator's properties will be used to render the values stored in the ExtMapBuffer1 buffer. In the next line, we set properties for our indicator. The first parameter of the SetIndexStyle method is the buffer number, which represents the value '0' that we specified in the SetIndexBuffer. The second parameter defines the type of drawing - a histogram. In the third parameter, we specify the line style lsSolid (actually, here we can specify any value, because the value of this parameter only affects the line and bar charts with thickness 1). In the next parameters, we set thickness 5 of the line and the blue color by using the corresponding constant clrBlue (we can also specify color in RGB format, for example, 0x0000FF).
Then comes the Run() function that performs basic checks and runs the draw() user function, which implements the entire calculation.
We store in the global variable ExtCountedBars the number of bars that have not changed since the last call. We have already calculated these values, so they do not have to be recalculated again. Next, we determine that we stop rendering the indicator at ExtCountedBars< 0. Then the draw() function is called that will calculate the values and locate them in the indicator buffer.
In the 'int pos=Chart.Bars-ExtCountedBars-1' line, we determine the starting position for calculating values moving from prior data to latter. With the number of bars totalling to Chart.Bars, the farther element will have the Chart.Bars-1 index; taking into account the number of already calculated bars, the index will be Chart.Bars-ExtCountedBars-1. The value variable is used for collecting statistics. Then, in the cycle from Chart.Bars-ExtCountedBars-1 to 0, we collect statistics for each bar for no more than period positions back (there is no need to calculate values for unloaded data).
Putting all the code together:
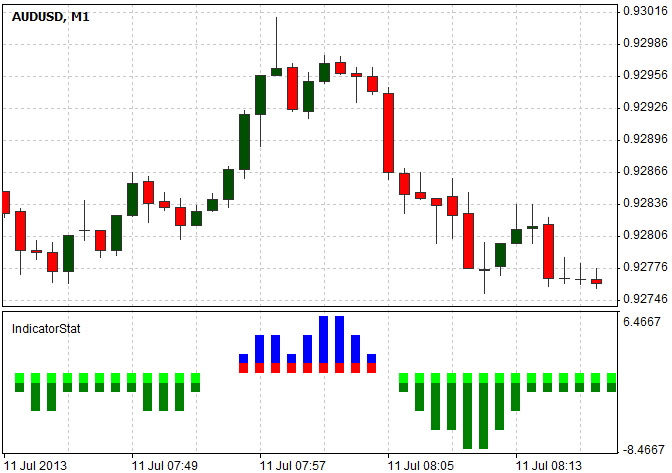
Now let us make a slight improvement to the indicator: the negative columns will be displayed in one color, the positive ones – in another. At the same time, each column will also have two colors. For this task, we need 4 buffers.
The new indicator version with colored bars:

When writing the indicator code, you may see the "run function call failed" message (unsuccessful call of the run function). This error is most likely to occur when the values are stored in elements with non-existing indices. So, if such a message appears, you need to carefully revise the values for buffer array indices.
Summary
In the present article, step by step, we made it through the creation of our first indicator. At the same time, the implementation was done in such a way so as to simplify the script understanding in NTL+. Althought the indicator itself might be of no use in trading, the technical implementation of the indicator covered in the article will become a valuable hands-on experience for everybody willing to create one.
