- Trading
- Instrument Specifications
- Synthetic Instruments Library
- EUR Index Investing
EUR Index - Euro Index Trading
Euro Currency Index Description
The Euro index is used for the analysis and trade of the main European currency EUR against the rest of the Forex market. A portfolio of most liquid currencies - EUR, USD, JPY, AUD, CHF, and CAD is used as a market systemic indicator.
Advantage
- The Euro index reaction to Eurozone fundamental events is the most obvious and stable.
- The Euro index forms a stable trend channel suitable for position trading.
- The Euro index sensitivity to fundamental events in other currency zones is minimal. This allows detecting low-volatility trend movement of the index that characterizes objectively the state of Eurozone.
The theoretical bases for building the instrument can be found below in the section “Application field”.
Structure
Parameters
Trading hours
Application field
Structure
| &EUR_Index | № | Asset | Volume / 1 PCI | Percentage | Volume (USD) / 1 PCI | Unit of measurеment |
|---|---|---|---|---|---|---|
| Base part | 1 | EUR | 778.6039 | 100.000 | 1000.0000 | EUR |
| Quoted part | 1 | USD | 43.500 | 4.3500 | 43.5000 | USD |
| 2 | JPY | 19811.427 | 18.2000 | 182.0000 | JPY | |
| 3 | GBP | 115.200 | 18.8000 | 188.0000 | GBP | |
| 4 | CHF | 180.353 | 19.2000 | 192.0000 | CHF | |
| 5 | AUD | 221.509 | 19.8000 | 198.0000 | AUD | |
| 6 | CAD | 215.170 | 19.6500 | 196.5000 | CAD |
Parameters
| Standard | Beginner | Demo | |
|---|---|---|---|
| Fixed spread, pip | |||
| Floating Spread, pip | |||
| Order distance, pip | |||
| Swap (long/short) in pips on Vol | |||
|
Available volumes | |||
| The value of 1 pip in USD for the Vol |
Trading hours
| Week day | Trading hours (CET) | Local trading hours |
| Monday | 00:00 — 24:00 | 00:00 — 24:00 |
| Tuesday | 00:00 — 24:00 | 00:00 — 24:00 |
| Wednesday | 00:00 — 24:00 | 00:00 — 24:00 |
| Thursday | 00:00 — 24:00 | 00:00 — 24:00 |
| Friday | 00:00 — 22:00 | 00:00 — 22:00 |
| Saturday | — | — |
| Sunday | — | — |
Application field
In the foreign exchange turnover study carried out by the Bank of International Settlement in April 2013 (http://www.bis.org/) 7 leading currencies, which we have included for considering, stand out in monthly exchange turnover volumes:
| Currency | Turnover share, % |
| USD | 43.5% |
| EUR | 16.7% |
| JPY | 11.5% |
| GBP | 5.9% |
| AUD | 4.3% |
| CHF | 2.6% |
| CAD | 2.3% |
In the right hand column the respective shares of currencies in the foreign exchange turnover of regulators are presented in descending order. We didn’t include in the systemic index the currencies that accounted for less than 2% of turnover.
In creating the index we consider (quote) euro against the “portfolio standard”, composed of 6 remaining liquid currencies: USD+JPY+AUD+CHF+CAD. The weight optimization is carried out so that the standard possesses the minimum sensitivity with respect to the events in Eurozone. The weights, which correspond to the quoted standard, are selected on the basis of currency zone ““non-interference”” principle.
Let us explain the application of that principle. The table of liquid currency priority for foreign exchanges quoted against euro is made on the basis of foreign exchange turnover 2013 study. (http://www.bis.org/publ/rpfx13fx.pdf)
| Currency pair | Turnover share, % | Residual influence share, % |
| EUR/USD | 24.1 | 6.7 |
| EUR/JPY | 2.8 | 28 |
| EUR/GBP | 1.9 | 28.9 |
| EUR/CHF | 1.3 | 29.5 |
| EUR/AUD | 0.4 | 30.4 |
| EUR/CAD | 0.3 | 30.5 |
The total share of euro turnover relative to the liquid instruments under consideration is 30.8%. Then the residual share is equal to the difference between the total share and the EUR/x currency pair share.
The residual share characterizes the currency (EUR) stability with respect to changes in the price of the quoted part. In order to introduce significant volatility into the index the participation of remaining “counterpart” currencies (EUR/x) is required with the weights equal to their share in the foreign exchange operations. Therefore the values from the right hand column of the Table 2 were applied for determining the currency weights for creation of the index.
Let us remind that the structure of the euro index can be represented as follows:
We shall take the wi weights for the standard proportional to the residual influence share (the right hand column of the Table 2). Thus, we are raising the index stability with respect to Eurozone events. Then it is the base part – Euro, that determines the index sensitivity. The estimates yield the following formula for the portfolio standard: USD(4.35%) + JPY(18.2%) + GBP(18.8%) + AUD(19.8%) + CAD (19.65%).
The instrument &EUR_Index is highly sensitive with respect to fundamental changes in EU economic development and therefore ideally suited for trend following strategy in periods when key fundamental events are anticipated: the ECB president announcements, the publications of the Balance of Trade, releases of consumer price indexes (CPI) and etc.
In NetTradeX trading platform buying the instrument means capital allocation between a long position in EUR and a short position in the portfolio standard:
USD(4.35%)+JPY(18.2%)+GBP(18.8%)+CHF(19.2%)+AUD(19.8%)+CAD(19.65%). As a result, the PCI is formed using the GeWorko model.
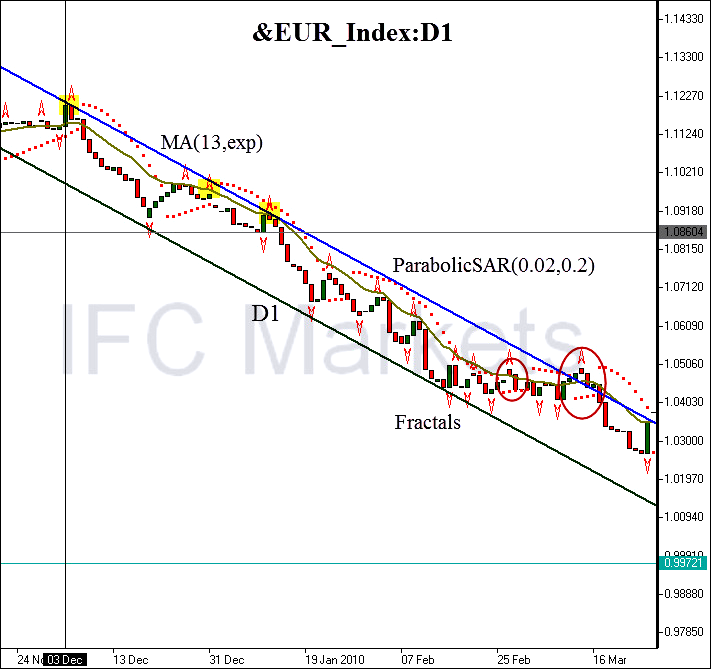
The vertical line marks the ECB President Jean Claude Trichet’s speech at a Brussels press conference on December 3, 2009. Trichet announced that ECB was starting the gradual reductions of its commercial bank support programs. Furthermore, floating interest rates would be applied for those programs. The announcement resulted in a fall in attractiveness of the European currency for foreign investors. The price of the PCI (Personal Composite Instrument) ended the sideways motion and formed a new downward trend channel, which confirms the weakening of the European currency. For the 85-day period of the trend channel existence the index yielded profitability equal to 6%. The trend channel width that characterizes volatility or risk, amounted to 1.8% of the starting price. We can estimate the position trading return by the profitability to risk ratio: 3.3 (>2). Thus the index is attractive enough for position trading.

Fig.1. &EUR_Index D1 chart

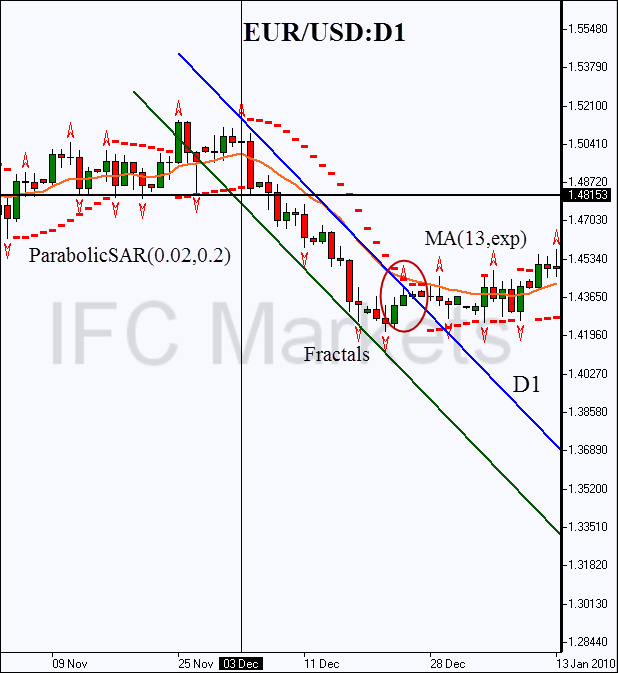
Fig.2. EUR/USD D1 chart
It should be noted that the elementary instrument EUR/USD reacted more unpredictably to the same event. The profitability equaled 2.7% and the volatility 2.1%. Thus the return of 1.3 was almost three times lower than that of the index: 1.3 vs. 3.3. Profitability was almost a factor of two smaller too. Note that the implied position was closed in both cases when the daily trend line was breached. The position was opened when the closest support level was crossed after December 3. This level was determined by the Bill Williams fractal and was equal to 1.48153 for euro (see figure 2).
As it is evident from the example, besides the attractiveness for trend trading our instrument allows to diversify the risks and avoid false instability. Note that after the ECB conference the fundamental events related to the developed economies of the remaining currency zones didn’t impact the index movement: the PCI filtered out the volatility.
For example, on 24 December 2009 a key monthly indicator – Unemployment Claims in US was published. The indicator came out lower than the forecast level (452K vs. 471K) and lower than the previous value of the indicator at 480K: Unemployment Claims fell 6%. The event resulted in a sharp strengthening of dollar, which corresponds to the breach of the EUR/USD currency pair trend line. Meanwhile, the &EUR_Index index reaction was more than level: the trend continued with a small correction. It should be noted, that the index trend channel lasted significantly longer than the elementary instrument channel. The individual risks connected with sharp changes in any of the developed economies are reduced due to the standard. It should be noted, that the optimization based on the “non-interference principle” allows to increase substantially the profitability and return. The violation of the principle results in the destabilization of the portfolio behavior. Let us consider another portfolio, created according to classical rules of index formation - for example, the asset weights of popular market indexes S&P500, DAX, CAC40 are determined according to the corresponding company capitalizations.
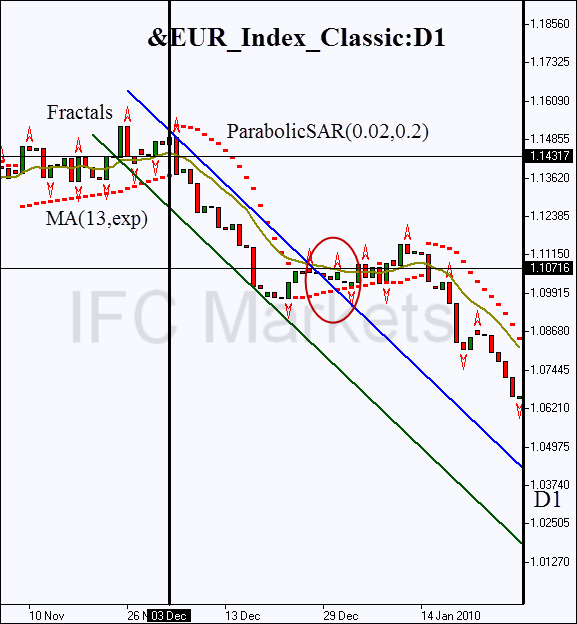
In accordance with that classical model let us set the wi weights for our standard proportional to the turnover share (the left hand columns in Table 2), which is the currency equivalent of capitalization. The daily chart of that index for the period when the ECB President’s press conference happened is presented in figure 3. The behavior of this classical index is analogous to that of the EUR/USD currency pair: the dollar has 80% share in the quoted portfolio due to the highest turnover share. That is exactly why the breach of the trend line happened not long afterward: on December 27, 2009. The diversification allowed to increase profitability to 3%, and the return to 1.3. At the same time volatility equaled 2.3%. Thus the index return equals the return of the currency pair EUR/USD with a slightly higher profitability: 3% vs. 2.7%. As is evident from the example, the classical model of index creation is not suitable for the currency zone, which justifies the use of the standard index created above.

Fig.3. &EUR_Index_Classic chart. Optimization by turnover share.
To trade PCI instruments offered exclusively by IFC Markets, you need to open a free account and download the NetTradeX platform.
- Clients Also Trade These Instruments


